Data Visualization
We make your SEO data more understandable
- No credit card required
- No installation needed
- No strings attached
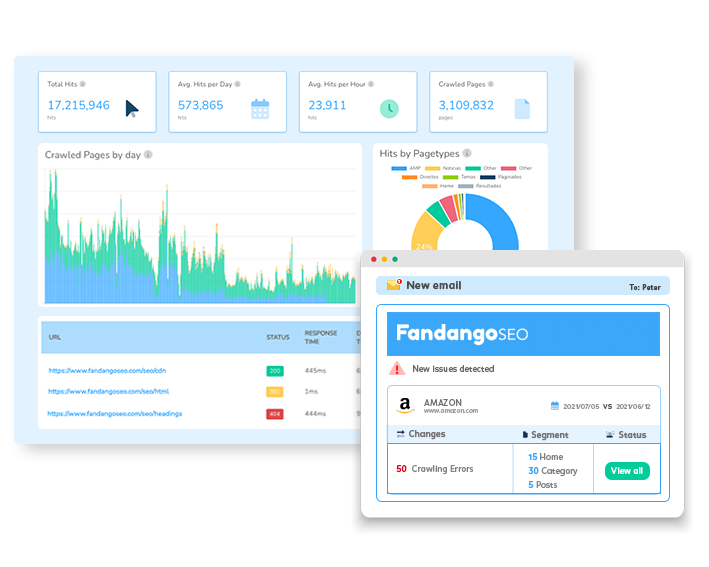
FandangoSEO's Data Visualization
Instantly identify areas of your site with duplicate content
Detect website performance anomalies
Easily see the difference between several crawls
Perform exhaustive data analysis
Download personalized reports in one click
What is SEO data visualization, and why is it important?
Images speak louder than words and numbers. SEO data visualization is the graphical representation of unstructured datasets. It transforms the information into visual charts that provide quick SEO insight.
FandangoSEO is setting trends in data visualization by providing beautiful interactive designs and real-time models.
When presenting Website audits to your clients, graphs always help them get a clearer picture of their current SEO performance. Using FandangoSEO you can export the charts to create comprehensive SEO audits.
FandangoSEO takes data visualization to the next level
- Segmented data
- Treemapping to check duplicate content
- Comparison charts
- Visualize your website architecture
Try it Free for 14 Days
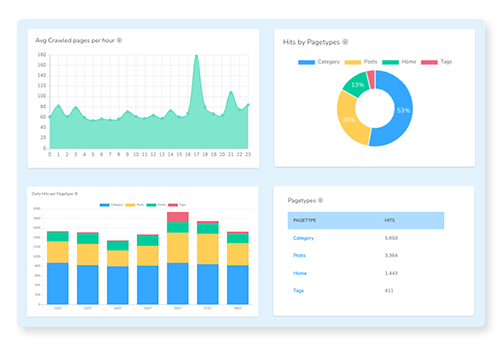
Segmented Data
Get extra insights by checking your data by website segments
Data segmentation is vital in SEO as it provides you with rich information about the performance of your pages according to their type.
Define your web segments and see your segmented data results in bar graphs and pie charts. You'll quickly identify which areas of your site need improvement.

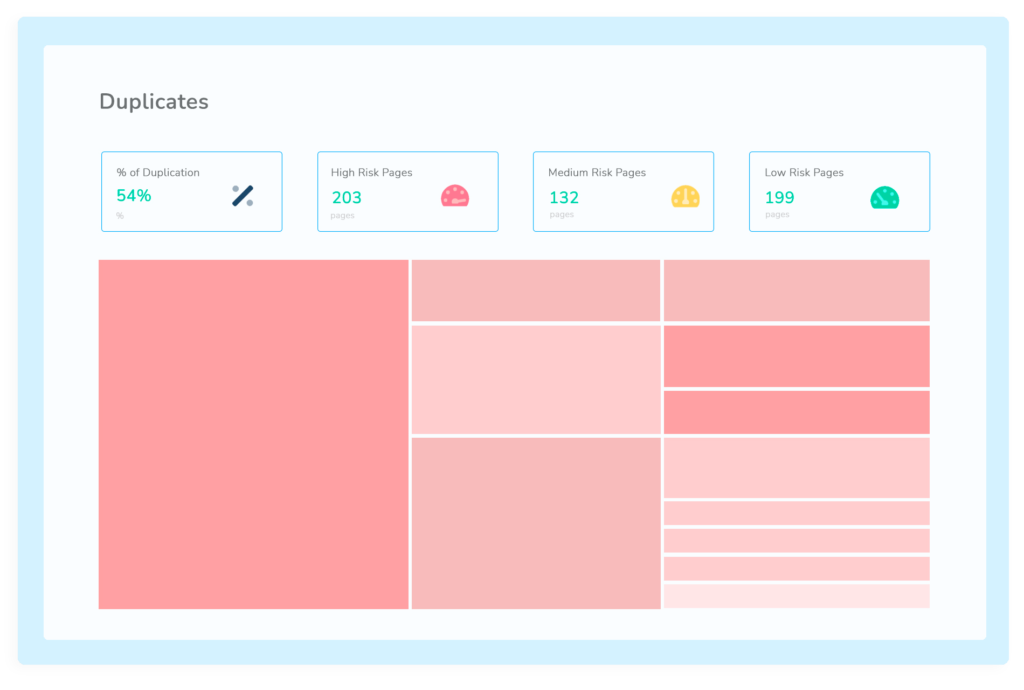
TreeMap
Instantly identify areas of your site with duplicate content
FandangoSEO detects and shows you duplicate content like no other SEO tool in the market.
The duplicate content checker shows you the degree of duplicity you have through the different segments of your site in a treemap. Quickly identify if you have any critical duplicate content issue in a given area of your site.
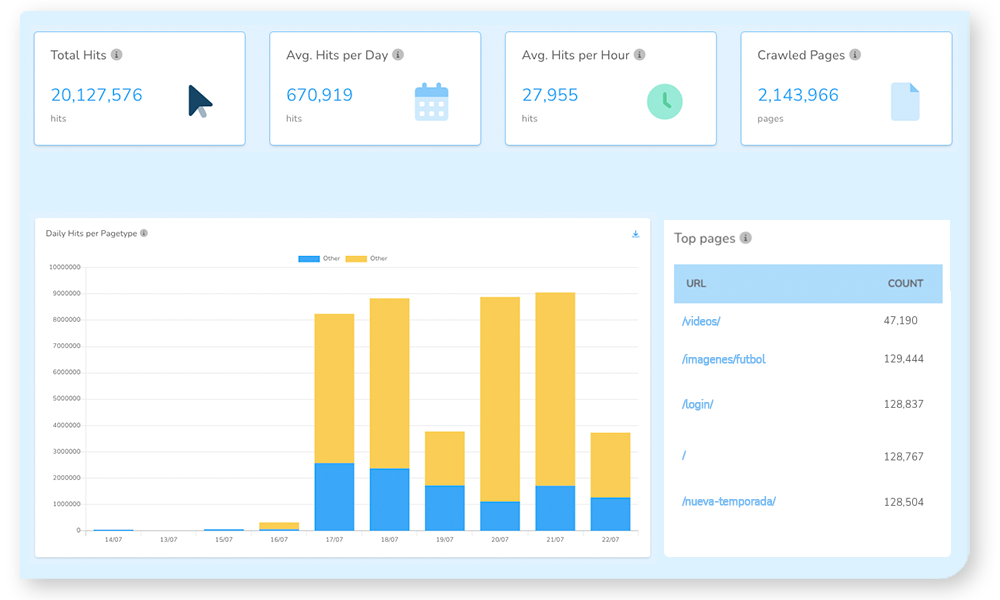
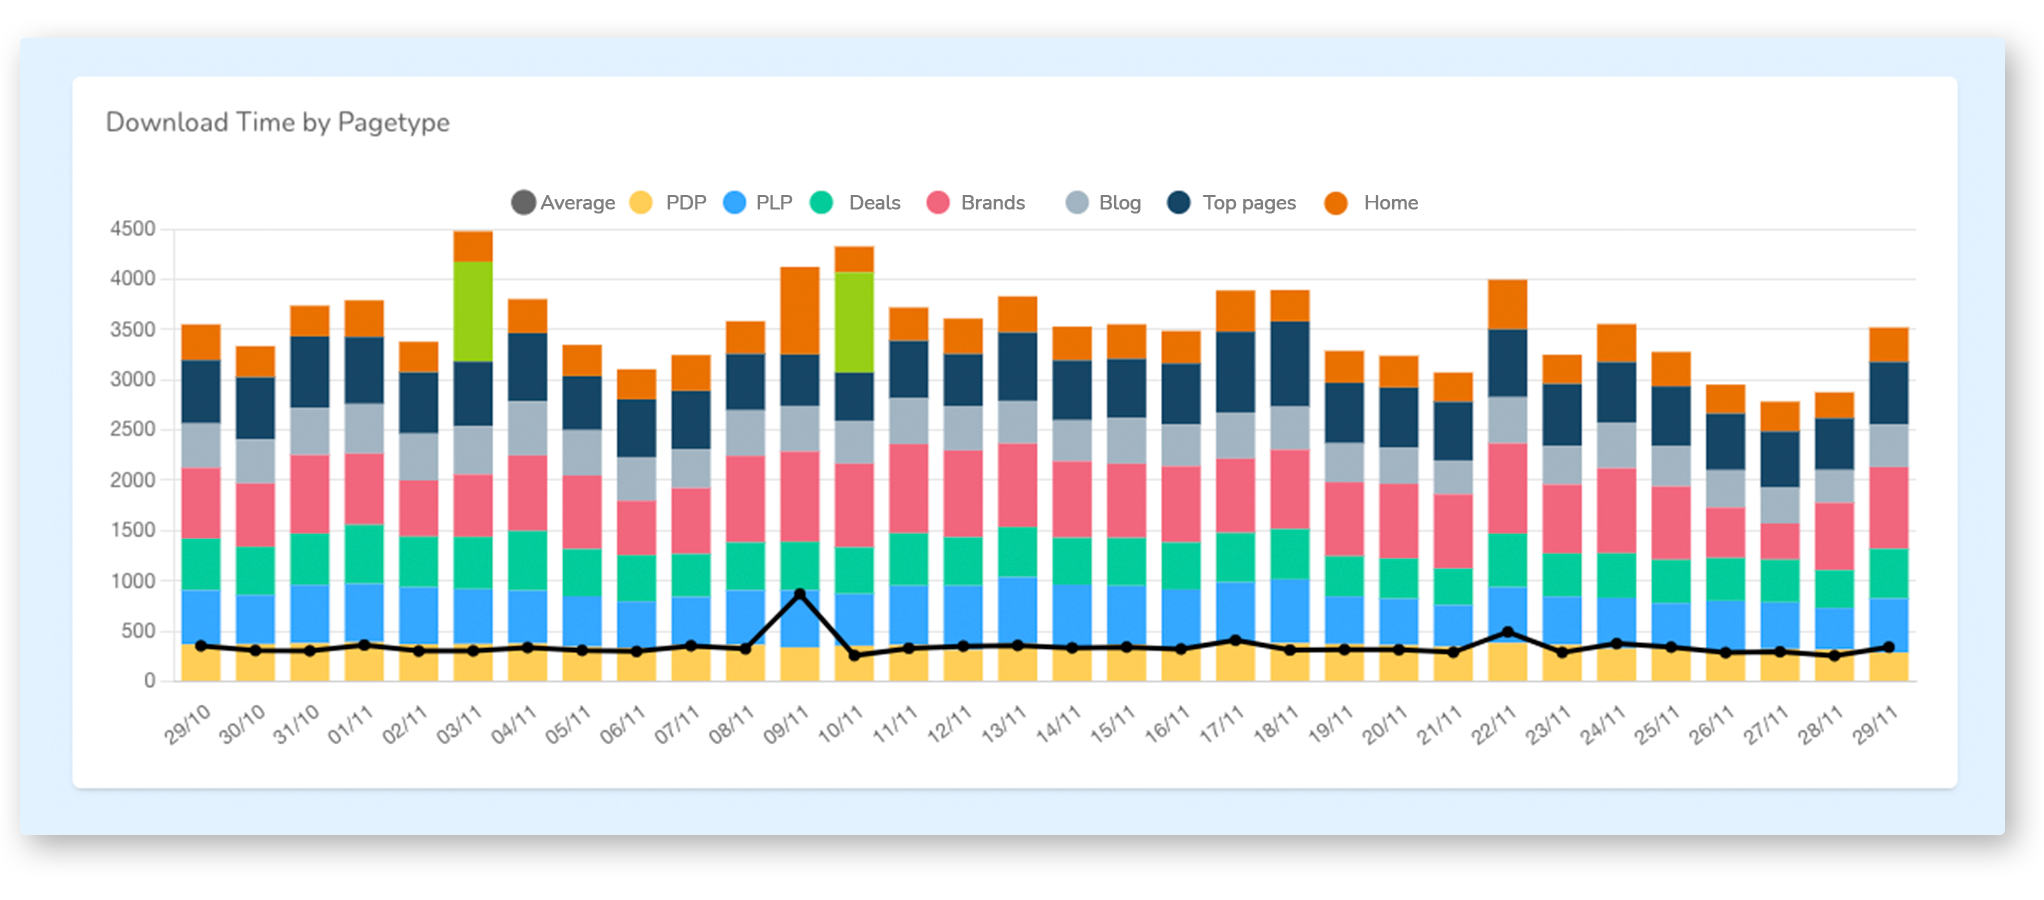
Page Speed Bar Graphs
Detect website performance anomalies
Check your Website's page speed through the log analyzer data at a glance. FandangoSEO provides you with three valuable log information graphics. See the size, the download time, and the loading time of your pages segmented by page types and dates.
There's no easier way to track your page speed performance.
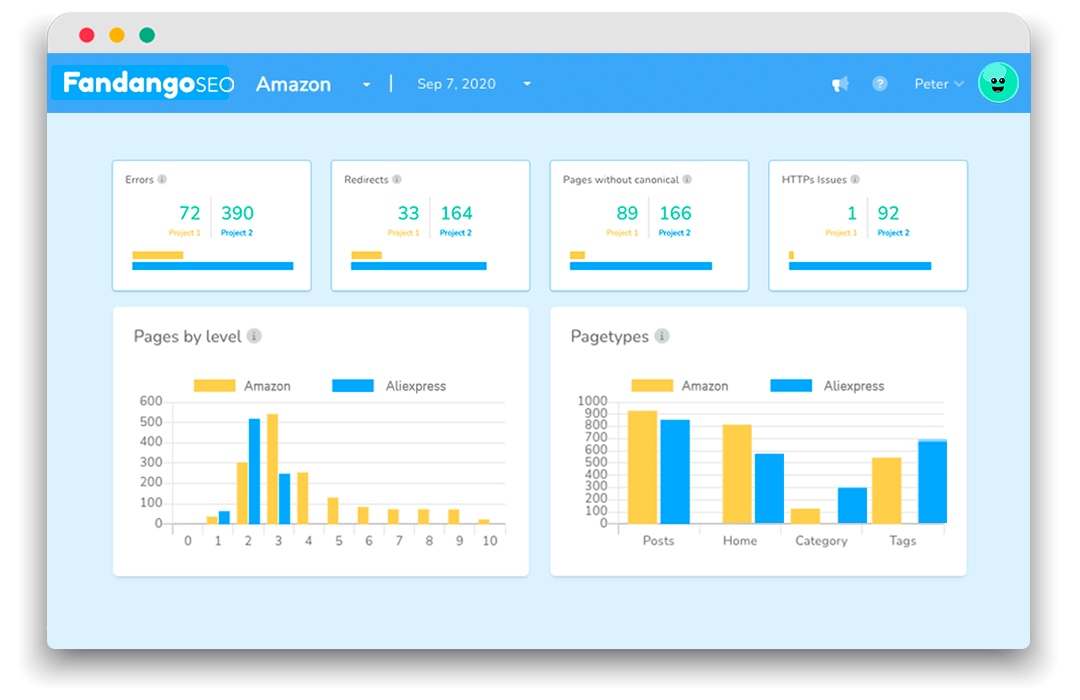
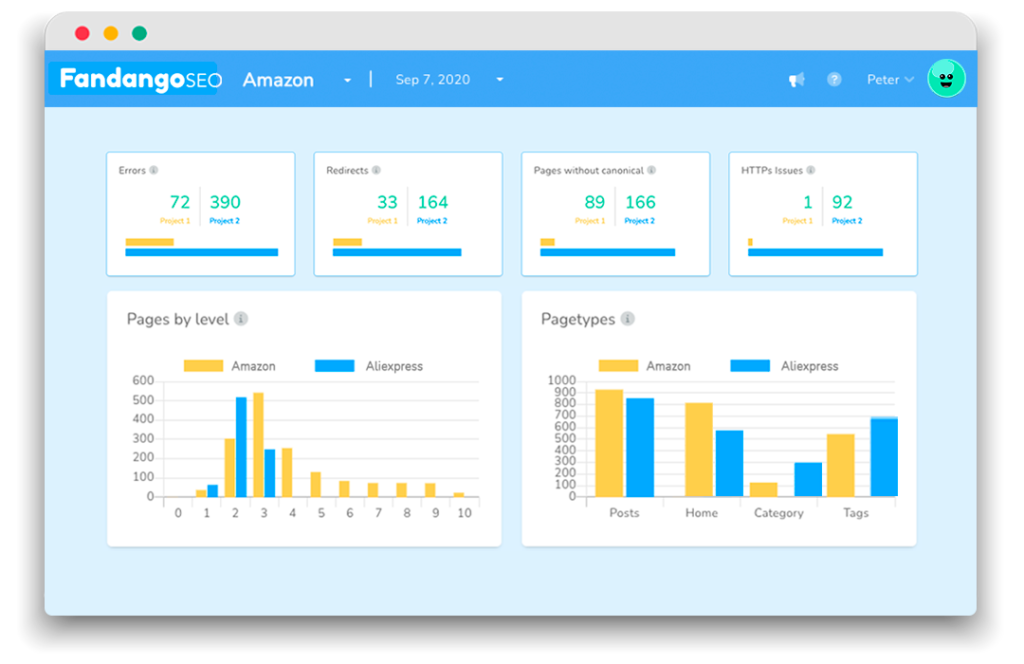
Comparison Charts
Easily see the difference between several crawls
Obtain comparison charts of various Website crawls. You can analyze the crawls of multiple dates to track your SEO progress or perform a competitive analysis by checking your competitor’s Websites.
See your data results in comparative bar graphs so you can immediately detect the differences between the crawls and get insights to improve your SEO performance.
- Interactive Charts
Perform exhaustive data analysis
Go deeper and deeper into details. Enjoy your data analysis without limitations. Most of FandangoSEO’s graphs are clickable so that you can see even the most minor details of your data. Perform comprehensive audits through interactive charts. You will also find graphs that are updated in real-time to provide you with the most current data.
- Custom SEO Reports
Download personalized reports in one click
Generate any SEO report and download it instantly with one click. FandangoSEO is an excellent SEO reporting tool that allows you to create custom SEO audit reports by filtering the desired segments. Also, you can create personalized log reports by selecting multiple filters and adding specific datasets on columns.
See your Website structure like never before
Ideal for large Websites
Visualize your Website architecture by segments
Audit your Website architecture to improve your internal linking. The Architecture Map by Segments allows you to visualize the entire internal linking structure of a site with millions of pages. Quickly check the structure of any Website, whatever its size.
Verify if the site's content is linked coherently. The tool shows you the Website structure by segmenting all existing pages into groups. You can see the PageType, Section, and Depth Level to which each group belongs. Moreover, you can visualize all your inlinks and outlinks to see the relationships between your pages.
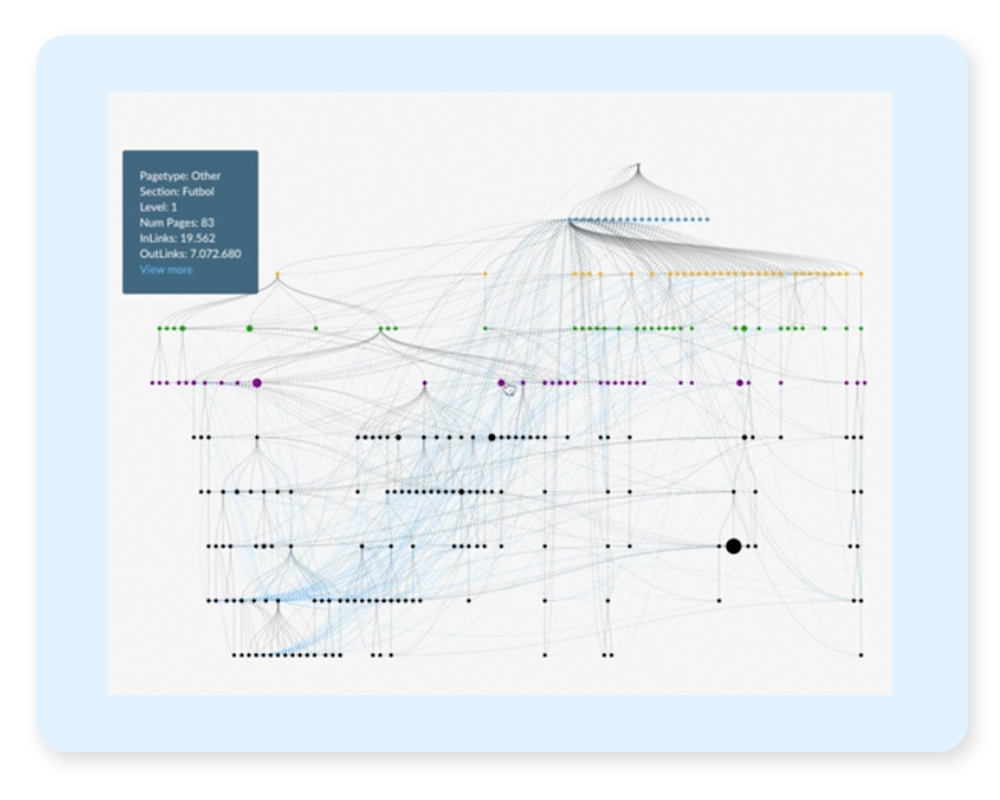
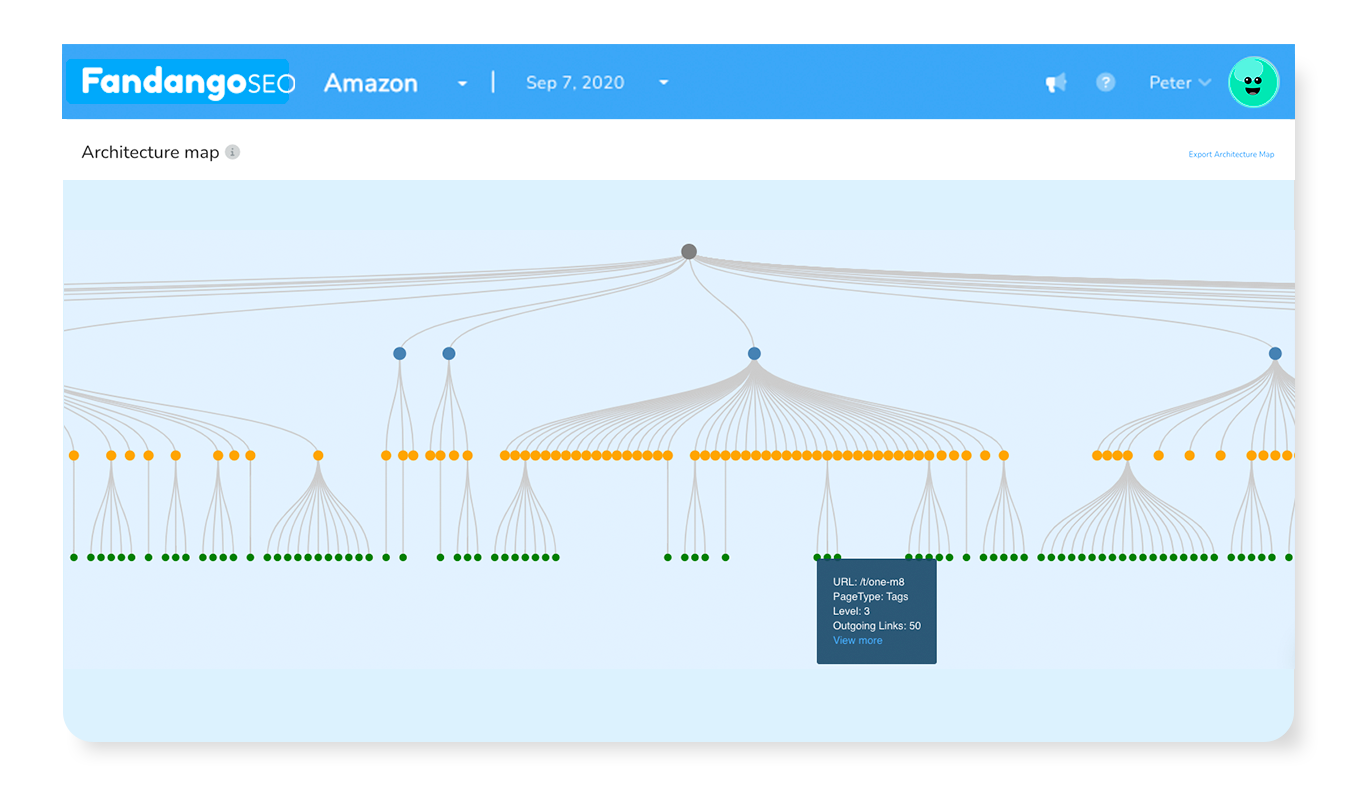

See your Website architecture by URLs
Quickly check the internal linking structure of a site to create the best Website architecture. The Architecture Map by URLs is ideal for showing your customers the site structure in a simple graph.
Each URL is represented by a node with a color that reflects the page depth level. It is the best tool to point out what needs to be modified. Everyone will immediately understand your instructions for improvements.
Try it Free for 14 Days
- No credit card required
- No installation needed
- No strings attached